


So, you may have seen us predicting the World Cup matches? Let me tell you why…
Here at DeeperThanBlue Analytics, our aim is to help our customers use their own data better, to improve business performance.
We break out the four stages of this process to:
See, Plan, Predict, Automate.
We thought it would be great fun and something a little different if we applied some simple predictive techniques to predict the outcome of each of the 64 world cup football matches. Football matches tend to be highly variable, with shock results happening fairly frequently. This variability would be useful to demonstrate how the modelling uses the shock results to effectively ‘learn’.
The first thing we needed to do was to select some data sources, across a range of types, which might represent how a company might organise its own data for planning, we call these ‘predictive drivers’.
We didn’t want to complicate the model too much by predicting numbers of goals or other more in-depth statistics, because we wanted to demonstrate as simply as possible how the process works without being too complicated to follow, we decided to predict the winner of each match (or a draw in the group stages).
We then had to start the model off by setting an initial weighting factor to each driver.
As we identified the drivers we were going to use, it became clear that some of the sources were highly advanced models in their own right (Soccer Power Index, ELO Ratings), so rather than create a new alternative, we decided to use our model to manage which of our drivers we should trust, we knew that for some matches the individual drivers would not agree.
This is often the case in business where you are faced with a range of different often conflicting opinions about the way forward.
The Predictive Drivers

*For the DeeperThanBlue consensus, to set the initial weightings, we asked our team members to rate themselves into three levels (expert, intermediate and novice).
Rather conveniently we found that they had a fairly even spread across the three categories, 6 experts, 6 intermediates, 7 Novices, this also gave us our own internal league table for a bit of team fun and engagement.
So, we now had enough of a range of indicators to give us some interesting spreads of predictions, it is a classic case of gut feeling v statistics. One of the biggest challenges facing the adoption of predictive analytics is changing the culture of the decision makers to move away from gut feeling to begin to trust the data.
The final step to start off with was to set initial weightings, we did this with a very simple grid:
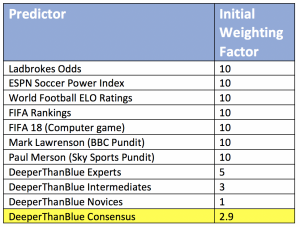
These weightings were then used to separate the initial predictions into Win, Loss or Draw and the predictive model then presented the highest aggregate weighting factor.
Match Predictions
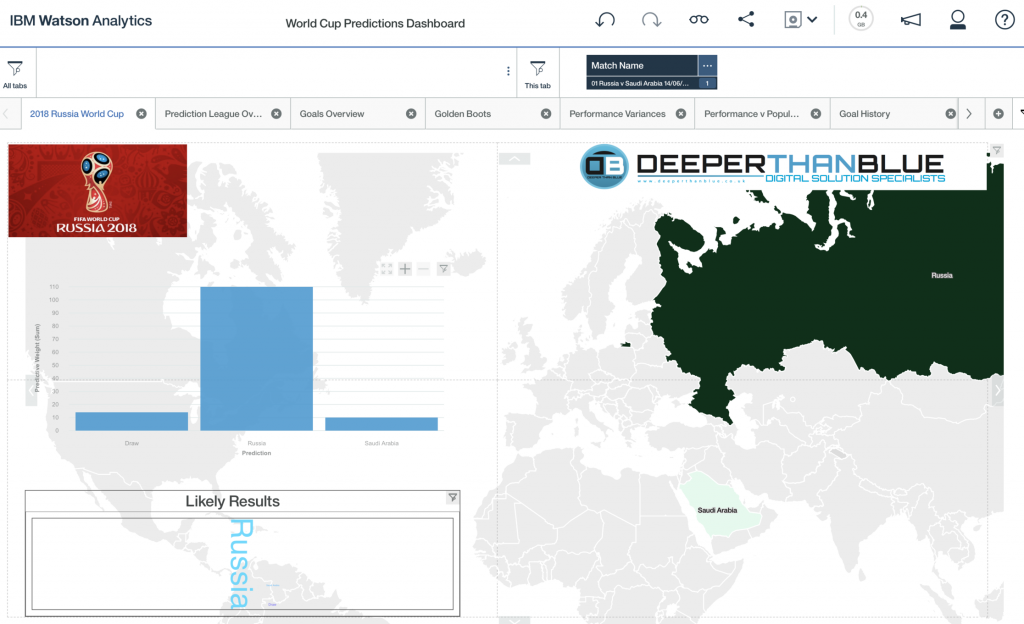
The first match prediction was Russia v Saudi Arabia 14/06/2018.
Within the DeeperThanBlue team there were a few people who chose Saudi Arabia and some who went for a draw, but the weighted majority favoured the home side.
Our predictive model was strongly weighted towards a Russia win.
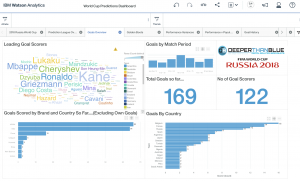
We built the data out into a tabular form, and uploaded it into IBM Watson Analytics, initially to present the data and to begin to build out a nice dashboard, which we then posted out to social media.
The Watson Analytics dashboards are very intuitive to create, we created a tabbed layout very quickly, features like the map had sufficient built in intelligence to recognise countries correctly (other visualisation platforms need some configuration to recognise England as a country for example):
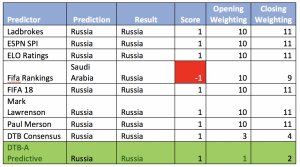
Russia did win the opening game, with a resounding 5 – 0 score line. The table below then explains how the predictive model added 1 point to the weighting for each correct prediction, and subtracted a point for each incorrect prediction. For the opening game the only incorrect predictor was the official FIFA ranking which had Russia in 70th place and Saudi Arabia slightly ahead in 67th place:
This process was then iterated with the weightings updated after each match to update the opening weightings ahead of the next match prediction, where possible due to timings.
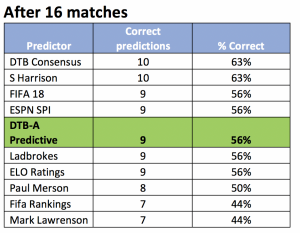
After the end of the first round (16 matches, see graph below) the predictive model was already the second highest performing source with 9 out of 16 matches correctly predicted, the first 16 games also created a few surprising results:
Iceland v Argentia = Draw
Brazil v Switzerland = Draw
Germany v Mexico = Draw
Then the second round of the group stages (32 matches, see graph below) proved to be more predictable, and the more statistical based drivers improved their scores:

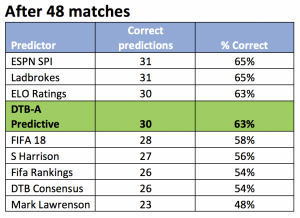
The final round of the group stages (48 matches, see graph below) once again produced a few more surprise results:
Iran v Portugal = Draw
Spain v Morocco = Draw
Denmark France = Draw
Through the knockout stages the three biggest shocks in terms of prediction frequency were:
Spain v Russia: Russia Win
Brazil v Belgium: Belgium Win
England v Croatia: Croatia Win (All predictions were for an England Win, but perhaps this was a result of bias in many cases)
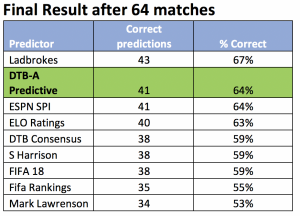
Overall the predictive model achieved equal second place, equal to the Soccer Power Index.
The bookmakers Ladbrokes came out on top once the initial shocks were out of the way.
The predictive model technique, kept as simple as possible, did prove to be a reliable technique, it didn’t beat the bookmakers, but that was not the point, the purpose was to demonstrate how with some straightforward techniques and a common-sense approach a reasonable level of accuracy can be found in something as unpredictable as football results.
Within the context of business planning these types of approaches can be used to measure each of the drivers within a business, this could be applied to sales forecast process or a labour scheduling process to give a couple of examples, thankfully in a business context, things are not quite as volatile as a football result, and there is usually a range of values we are working to not just a win or loss.
With IBM Watson Analytics we are able to measure the predictive strength of each driver, we can quickly deliver ad hoc reports and share visualisations, importantly we can use it to make decisions that we can trust, this can be a great way to quickly develop and prototype ideas.
It is not a case of simply jumping from gut feeling into statistical analysis, here we are showing that there is a way to blend and transition slowly by demonstrating, measuring and building up trust.
Not content with predicting the matches we also used the dashboards to produce some interesting visualisations for key statistics.
Prediction League Table
This shows the cumulative correct predictions for each predictor, demonstrating how clicking on the yellow bar on the left chart focuses attention on the right hand chart:

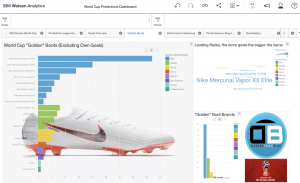
Goals Overview
This a range of visualisations for who scored, what period of the match, wearing which brand and which country. I particularly like the word cloud where the leading scorers have the largest font sizes for the name:
Analysis of goals scored by brand, and football boot style
Blending in graphics into the dashboard, to see the leading product:
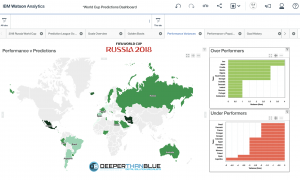
Performance v Prediction
Tracking actual performance v expected, could easily be used to explore under performing areas of a business, the map can zoom down to street level for a retail sales v budget scenario. Its also worth noting that the separate parts of the visualisation can be clicked as filters, e.g if a country is under performing it could quickly home in on a city or down to a store:
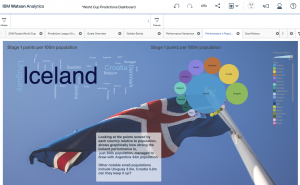
Performance v Population
Graphical backgrounds can bring this to life, and reinforce the leading performer, here it shows how the smallest country in the finals Iceland over performed relative to its population.
Later in the tournament Croatia, a country of 4m people reached the final:
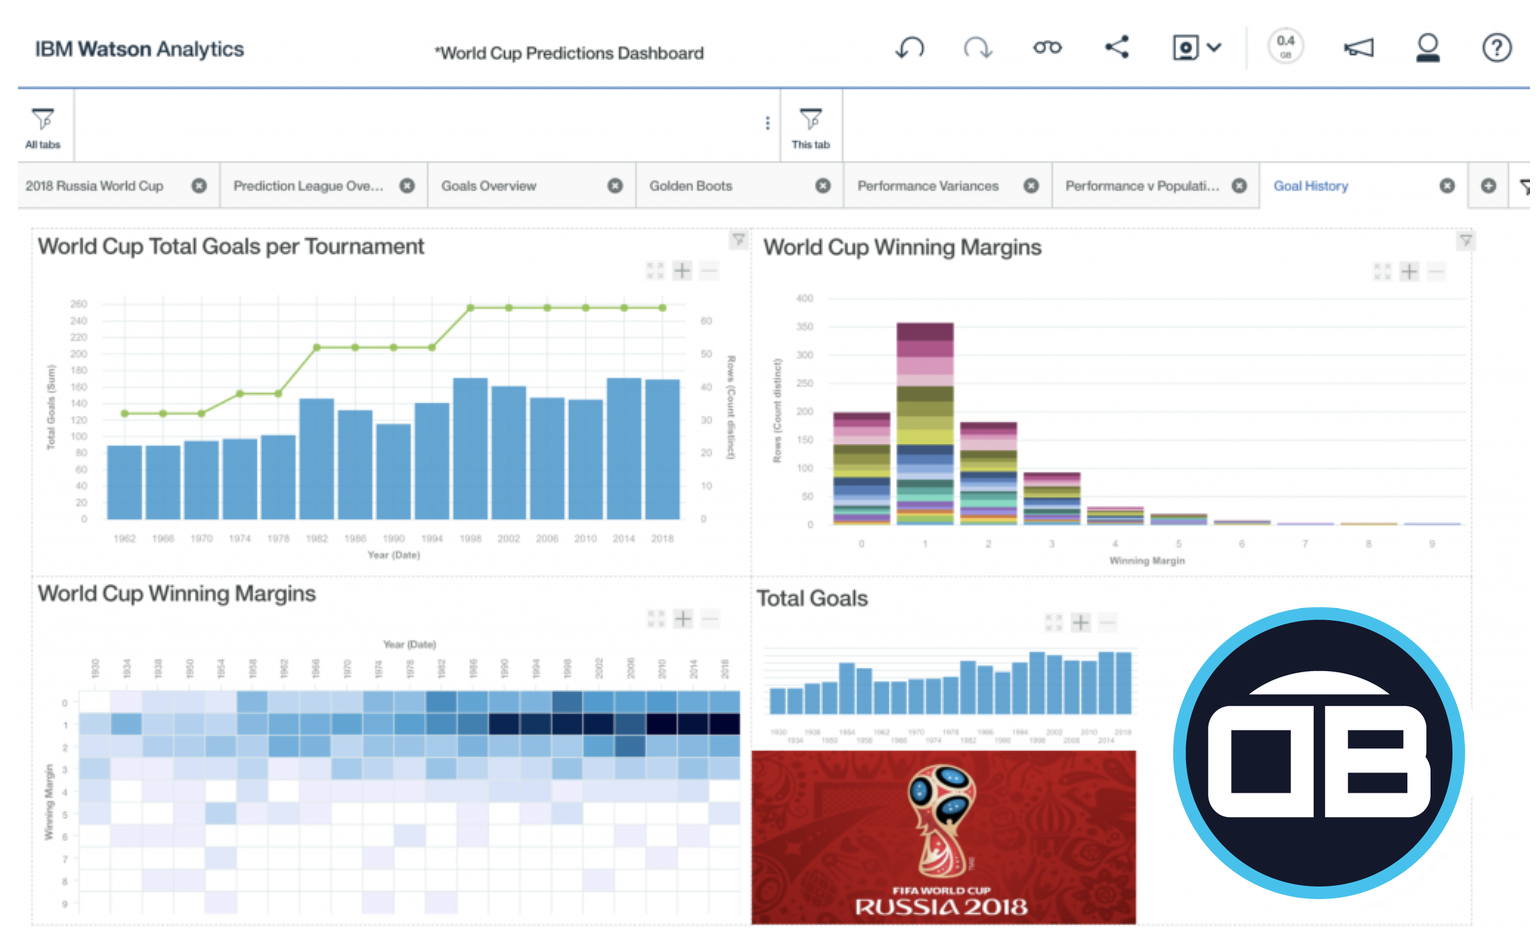
World Cup Finals Goals History 1930 – 2018
Depicting the number of goals for each tournament, and the winning margins, and showing the trend for the winning margins narrowing to just 1 goal typically, which probably demonstrates how competitive the finals has become over time:

Thanks for reading!
To find out how we can use the techniques and tools to help your business improve performance please contact myself, Simon Harrison – Operations Director for DeeperThanBlue Analytics:
simon.harrison@deeperthanblue.co.uk
or call +44 (0) 114 399 2820
Also, why not watch our Analytics video to find out how we can See, Plan Predict your company success:
To find out more background for some of the data sources please see the links below:
Drivers:
- SPI Soccer Power Index (reads taken at the start of each stage) https://projects.fivethirtyeight.com/2018-world-cup-predictions/
- Guide to ratings http://www.espn.com/world-cup/story/_/id/4447078/ce/us/guide-espn-spi-ratings
- Team ratings http://eloratings.net/
- Calculations http://eloratings.net/about
FIFA Rankings:
These might interest you
How analytics helps businesses ‘See, Plan, Predict’ for success
Business analytics tools can help you and your organisation read and digest data en masse with our See, Plan, Predict Read MoreDeeperThanBlue launches Analytics division
DeeperThanBlue today launched its Analytics division, helping businesses turn data into insights to drive performance and growth. Whilst many companies Read MoreIf you are interested in excelling in your market, becoming a digital disruptor or simply finding out more please get in touch.
+44 (0)114 399 2820
info@deeperthanblue.com